
The Price of a Day: Why Custom Manufacturers Should Measure Capital-Days, Not Just Delays
On 5 November, the Bank of England raised Bank Rate to 4%. Every manufacturer with an overdraft, a revolving credit facility or term debt felt the implication immediately: money held in the business now costs more than it did a month ago. Read the Bank of England's opening remarks.
But there is one place where that higher price is almost never calculated: the pre-production queue.
Ask a custom manufacturer what a delayed order costs and you will usually be given an answer in days. The order is 30 days late. It has been waiting six weeks. Engineering is two weeks behind plan.
Days are not a currency. And a day is not a standard unit of cost.
What does one day of pre-production delay actually cost — in pounds, order by order?
Most businesses cannot answer that question today. Not because the information does not exist, but because two different things are being measured separately and never multiplied together: how much capital an order has exposed, and how long that capital stays exposed.
Time without capital is just a schedule problem. Capital without time is just a balance. The cost lives in the product of the two.
A new unit: the capital-day
A capital-day is £1 of net exposed capital held for one day.
Net exposed capital, for this purpose, is the capital the manufacturer has genuinely put at risk on an order: cash already spent, plus commitments that cannot be undone without cost, less the customer deposit actually held. The precise definition is a policy choice. What matters is that it is defined once, defined clearly, and applied consistently to every order.
An order's capital-days are then simple to state:
- Capital-days = the sum of each day's net exposed capital, for every day before production release.
- Carrying cost = capital-days × (annual cost of capital ÷ 365).
This is not a new cost. It is a cost the business is already paying — through interest, through the return its own capital could have earned elsewhere, or through the borrowing headroom the exposure consumes. The capital-day simply makes it visible at the level where decisions are taken: the individual order.
A worked example
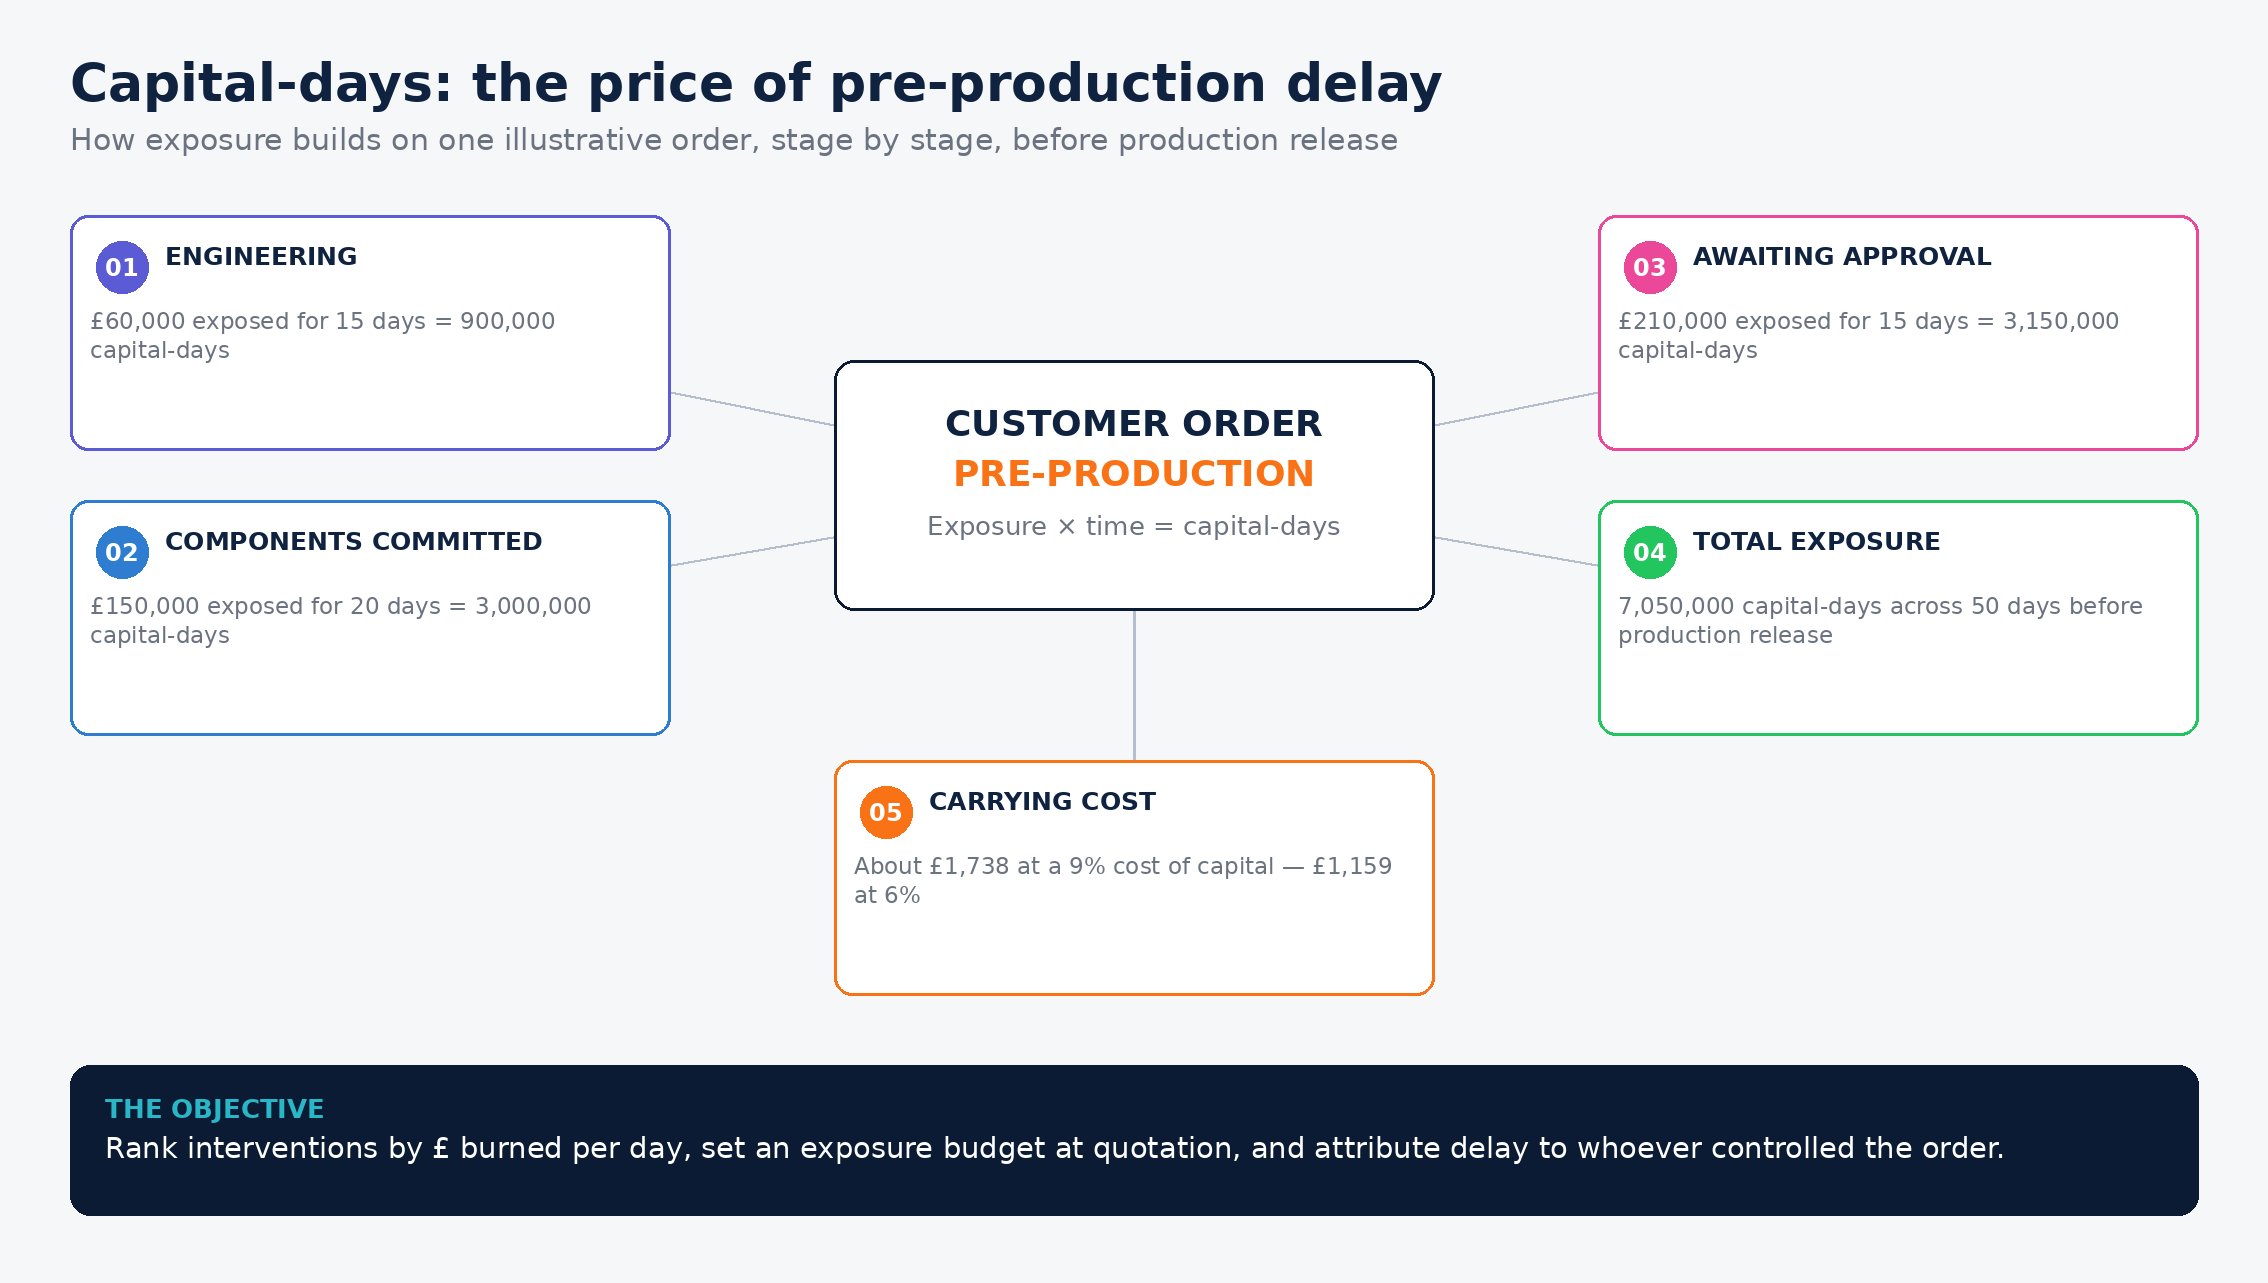
Take an illustrative custom order. Its net exposure builds in stages as engineering completes and long-lead components are committed:
| Period | Days | Average net exposure | Capital-days |
|---|---|---|---|
| Engineering under way | 15 | £60,000 | 900,000 |
| Components committed | 20 | £150,000 | 3,000,000 |
| Awaiting customer approval | 15 | £210,000 | 3,150,000 |
| Total | 50 | 7,050,000 |
At a 9% annual cost of capital, 7,050,000 capital-days cost about £1,738. At 6%, the identical delay costs about £1,159.
Three things follow from that one calculation.
First, the same 50 days became roughly £579 more expensive when the rate environment moved; without anything in the factory changing. Second, more than 44% of the entire carrying cost accrued in the final 15 days, while the order was simply waiting for an approval, because that is when exposure was at its highest. Third, by the final stage the order was consuming about £52 of carrying cost every day it sat still.
These figures are illustrative, built from stated assumptions, not benchmarks. Your cost of capital, exposure profile and state durations will differ. The method — not the numbers — is the point: any manufacturer can run this calculation on a real order this week, from records it already holds.
Three decisions capital-days change
A measure is only useful if it changes a decision. Capital-days change at least three.
1. Interventions get ranked by money, not by age
Most pre-production queues are worked in age order: the oldest order gets attention first. Capital-days suggest a different queue, ranked by the carrying cost each order is accruing per day.
At a 9% cost of capital, an order with £300,000 exposed burns about £74 a day. An order with £20,000 exposed burns about £5 a day. The second order can be three times as old as the first and still deserve second place in the intervention queue.
Age tells you who has waited longest. Capital-days tell you who is costing you most while they wait.
2. Every order gets an exposure budget at quotation
Manufacturers already set one limit at quotation: the price. Capital-days allow a second: an exposure budget.
At quotation, the planned spend profile and the expected duration of each pre-production state produce a forecast of the order's capital-days. That forecast becomes the budget. When an order consumes, say, 80% of its budget with production release still not in sight, escalation is triggered while intervention can still change the outcome — not in a month-end report.
After completion, budget against actual becomes one of the most revealing comparisons in the business. Which order types systematically overrun their exposure budgets? Which customers? A customer whose approvals routinely take three weeks is not necessarily a bad customer — but the carrying cost of their decision-making belongs in the economics of serving them, and today it almost never appears there.
3. Delay gets attributed, and payment schedules follow the cost curve
Because capital-days accumulate day by day, they can be split by who controlled the order during those days: days waiting on a customer decision, days waiting on a supplier, days consumed internally.
That attribution changes commercial conversations. Instead of a general complaint that an order "took too long", Finance can state that 15 days of customer-attributable waiting at peak exposure consumed a specific, calculated number of capital-days. Whether that cost is charged, absorbed or designed away is a commercial decision, but it can finally be an informed one.
Attribution also points to the structural fix: payment schedules designed around the order's cost-incurrence curve rather than convention. Flat deposit percentages,30% on order, 40% on dispatch, 30% on delivery, exist by habit, not by analysis. If deposits and milestone payments are timed so that cash received tracks the exposure being created, net exposure stays low, capital-days shrink, and the same delay costs the business — and arguably the customer relationship — much less.
What you need to capture. And what Peppasync is for
Capital-days cannot be reconstructed reliably from a month-end trial balance. They need a daily exposure position per order, and a timestamped record of which state the order was in on each of those days. That record is what makes both the calculation and the attribution possible.
This is where the pre-factory state stops being an operational detail and becomes financial infrastructure. If state transitions are captured as they happen, with the order's financial position attached, capital-days are a by-product. If they are reconstructed afterwards from emails and spreadsheets, the number arrives too late and costs too much to produce.
Peppasync focuses on working capital management for custom manufacturing, with particular attention to capital exposed before production begins. Timestamped pre-factory state data - which order is in which state, since when, and with what financial exposure attached, is the raw material that turns delay from a diary problem into a priced one.
The CFO question
Finance teams are fluent in the cost of the factory: machine rates, labour rates, overhead absorption. The pre-factory queue, by contrast, is usually priced at nothing per day, which is the one price it certainly does not have.
So the question is not how old your oldest order is.
Do you know which order in your pre-production queue is costing you the most money today and what tomorrow will add to its bill if nothing changes?
If the answer requires a spreadsheet project to find out, that is the first intervention worth making. The delay has a price. It is already being paid. Capital-days are simply how you start reading the meter.